
Understanding Candlesticks: A Beginner’s Guide
How Candlestick Charts Help Traders Read Market Movements

When trading in financial markets, understanding price movement is crucial. While there are many ways to analyze charts, candlestick charts remain one of the most popular tools among traders. They offer a visual representation of price action, making it easier to interpret market sentiment.
Even though candlesticks don’t provide all the answers, they can help traders make more informed decisions. Whether you’re a beginner or an experienced trader, understanding how candlesticks work is an essential skill.
What Is a Candlestick?
A candlestick is a type of price chart used in technical analysis that visually represents how an asset’s price moved during a specific time period. It contains four important pieces of information:
Open Price – The price at which the asset started trading for that period.
High Price – The highest price reached during that period.
Low Price – The lowest price reached during that period.
Close Price – The price at which the asset finished trading for that period.
Each candlestick represents a specific timeframe, which could be one minute, five minutes, one hour, one day, or even one month, depending on the chart setting.
Understanding the Structure of a Candlestick
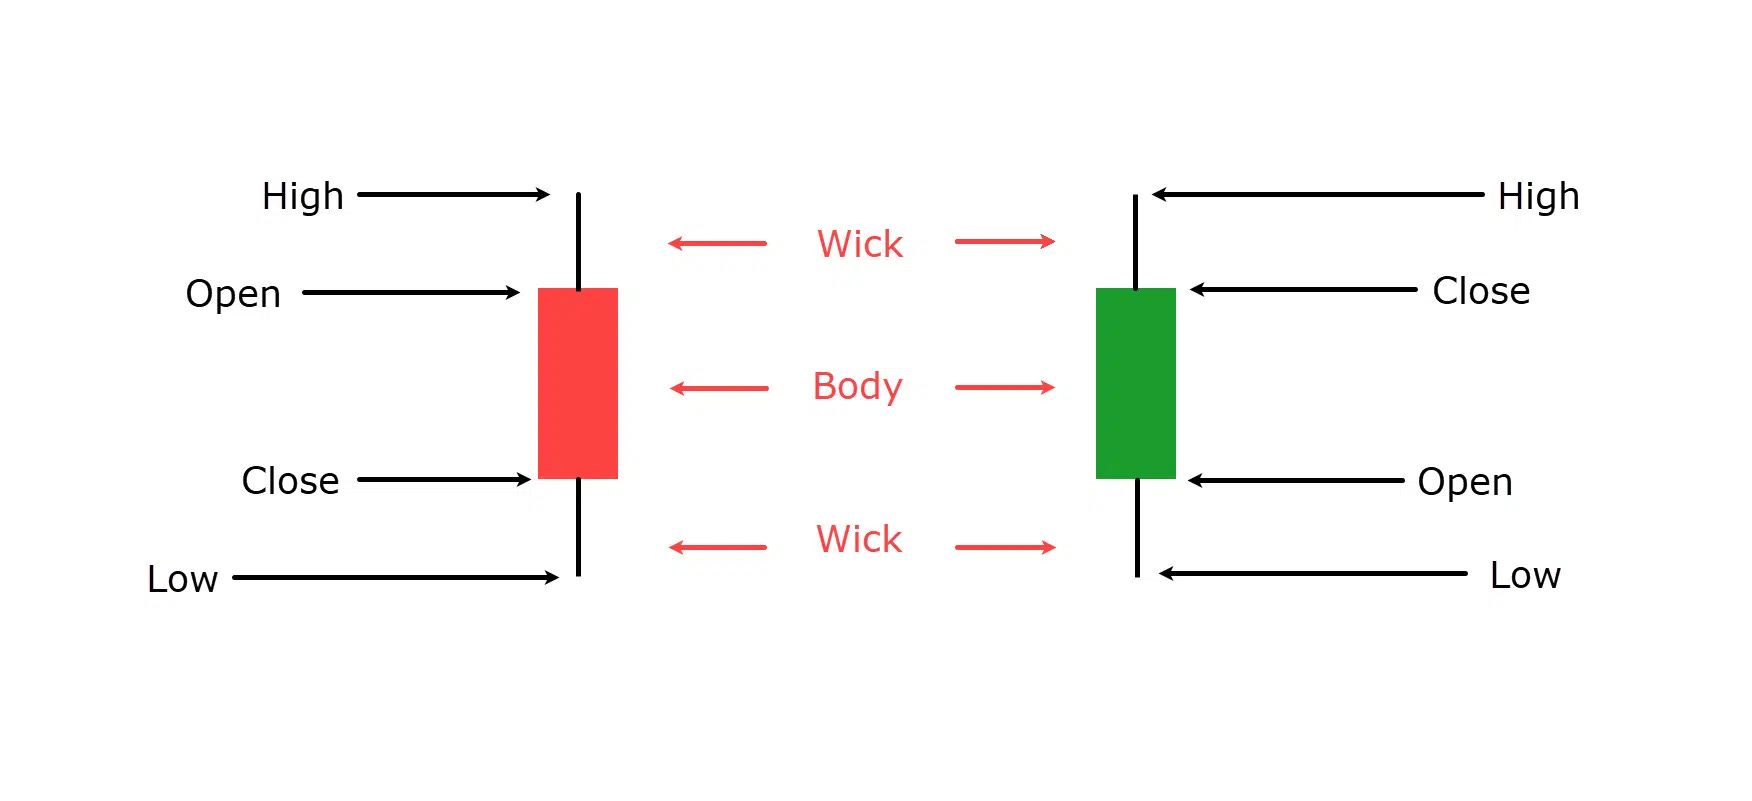
A candlestick consists of two main parts:
1. The Body
The body is the thick part of the candlestick and represents the difference between the opening and closing prices.
If the closing price is higher than the opening price, the candlestick is usually green (or white), indicating that buyers pushed the price up.
If the closing price is lower than the opening price, the candlestick is usually red (or black), indicating that sellers pushed the price down.
2. The Wicks (or Shadows)
Thin lines extend from the top and bottom of the body. These are called wicks or shadows, and they show the highest and lowest prices reached during the period.
The upper wick represents the highest price during the period.
The lower wick represents the lowest price during the period.
If a candlestick has long wicks, it means there was significant price movement during the period, but the price eventually settled closer to the open or close. If a candlestick has short or no wicks, it means the price remained close to the opening and closing levels.
Types of Candlesticks: Bullish, Bearish, and Doji
Candlesticks can be broadly categorized into bullish, bearish, and doji types based on how the price moved within a given period.
1. Bullish Candlesticks (Buying Pressure)
A bullish candlestick forms when the closing price is higher than the opening price. This means buyers were in control during that period, pushing the price upward.
Characteristics of Bullish Candlesticks:
Typically green or white in color.
A long body suggests strong buying pressure.
A short body with long wicks may indicate indecision but still a slight bullish bias.
Bullish candlesticks are important when they appear in a downtrend, as they may signal a reversal or the beginning of an uptrend.
2. Bearish Candlesticks (Selling Pressure)
A bearish candlestick forms when the closing price is lower than the opening price. This means sellers dominated during that period, driving the price downward.
Characteristics of Bearish Candlesticks:
Typically red or black in color.
A long body suggests strong selling pressure.
A short body with long wicks may indicate indecision but still a slight bearish bias.
Bearish candlesticks are significant when they appear in an uptrend, as they may indicate a reversal or the beginning of a downtrend.
3. Doji Candlesticks (Market Indecision)
A doji candlestick forms when the open and close prices are nearly the same. This suggests that neither buyers nor sellers had control, leading to market indecision.
Characteristics of Doji Candlesticks:
Very small or no body.
Wicks may be long or short, depending on volatility.
Often appears before a potential reversal or trend continuation.
A doji alone does not confirm a trend change, but it signals that traders should watch for further confirmation before making decisions.
Why Are Candlesticks Important?
Candlestick charts are widely used because they give traders a quick and clear visual of market sentiment. They help answer key questions such as:
Who is in control, buyers or sellers?
Was there strong price movement or indecision in the market?
Is a trend likely to continue or reverse?
By learning how to interpret candlesticks, traders can spot potential trading opportunities and make better decisions. However, candlesticks should not be used alone as they work best when combined with other technical indicators such as moving averages, volume analysis, or trend lines.
Final Thoughts
Candlestick charts are an essential tool for any trader. They provide valuable insight into market psychology and price action, making it easier to identify trends and potential reversals.
As you gain more experience, you’ll start recognizing patterns that frequently appear on candlestick charts. While candlesticks won’t guarantee success, they will certainly help you make more informed trading decisions.
Check out some of our candlestick pattern apps
Easy Doji (Android)
Easy Engulfing Patterns (Android)
Easy Fractals (Android)
Easy Pinbar (Android)
Easy Dashboard (Android)
Easy Dashboard (iOS)
For support, contact us at support@easyindicators.com.