


Oil Price Drops Sharply After Ceasefire
Are We Nearing a Short-Term Rebound or More Downside?


After weeks of escalating tension in the Middle East, markets were caught off guard by a sudden ceasefire between Israel and Iran. Oil prices, which had surged in anticipation of supply disruptions, reversed sharply as traders quickly unwound long positions.
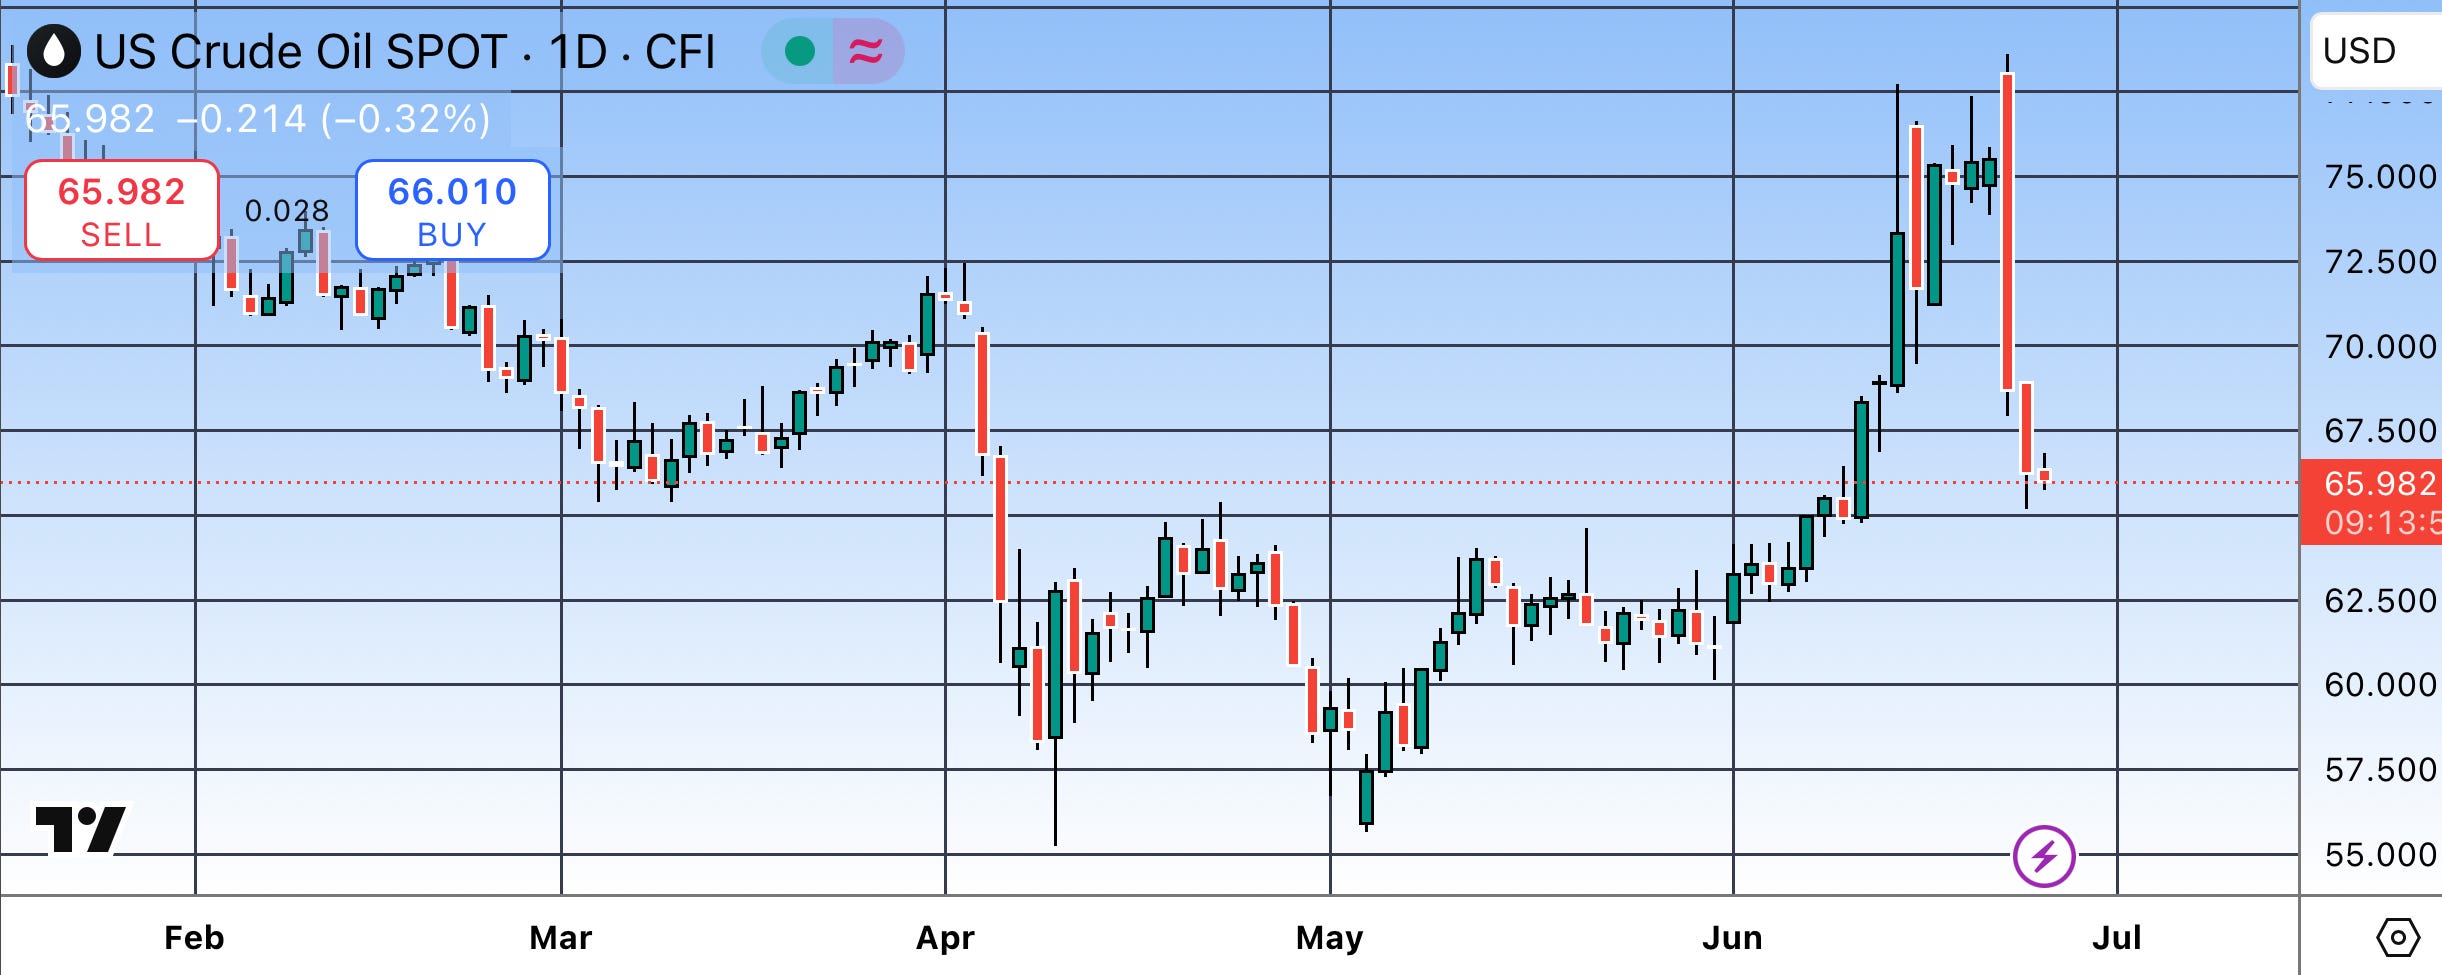
As of now, WTI crude is trading around $65.98, down from recent highs near $76, one of the sharpest pullbacks in months.
But how much further can it fall? And what are the technicals saying?
Chart Snapshot: A Violent Reversal
Looking at the daily chart, the price has wiped out nearly all of June’s gains in just a few days. The current candle shows continued pressure, with no strong reversal yet in sight.
What Our EasyIndicators Dashboard Is Telling Us
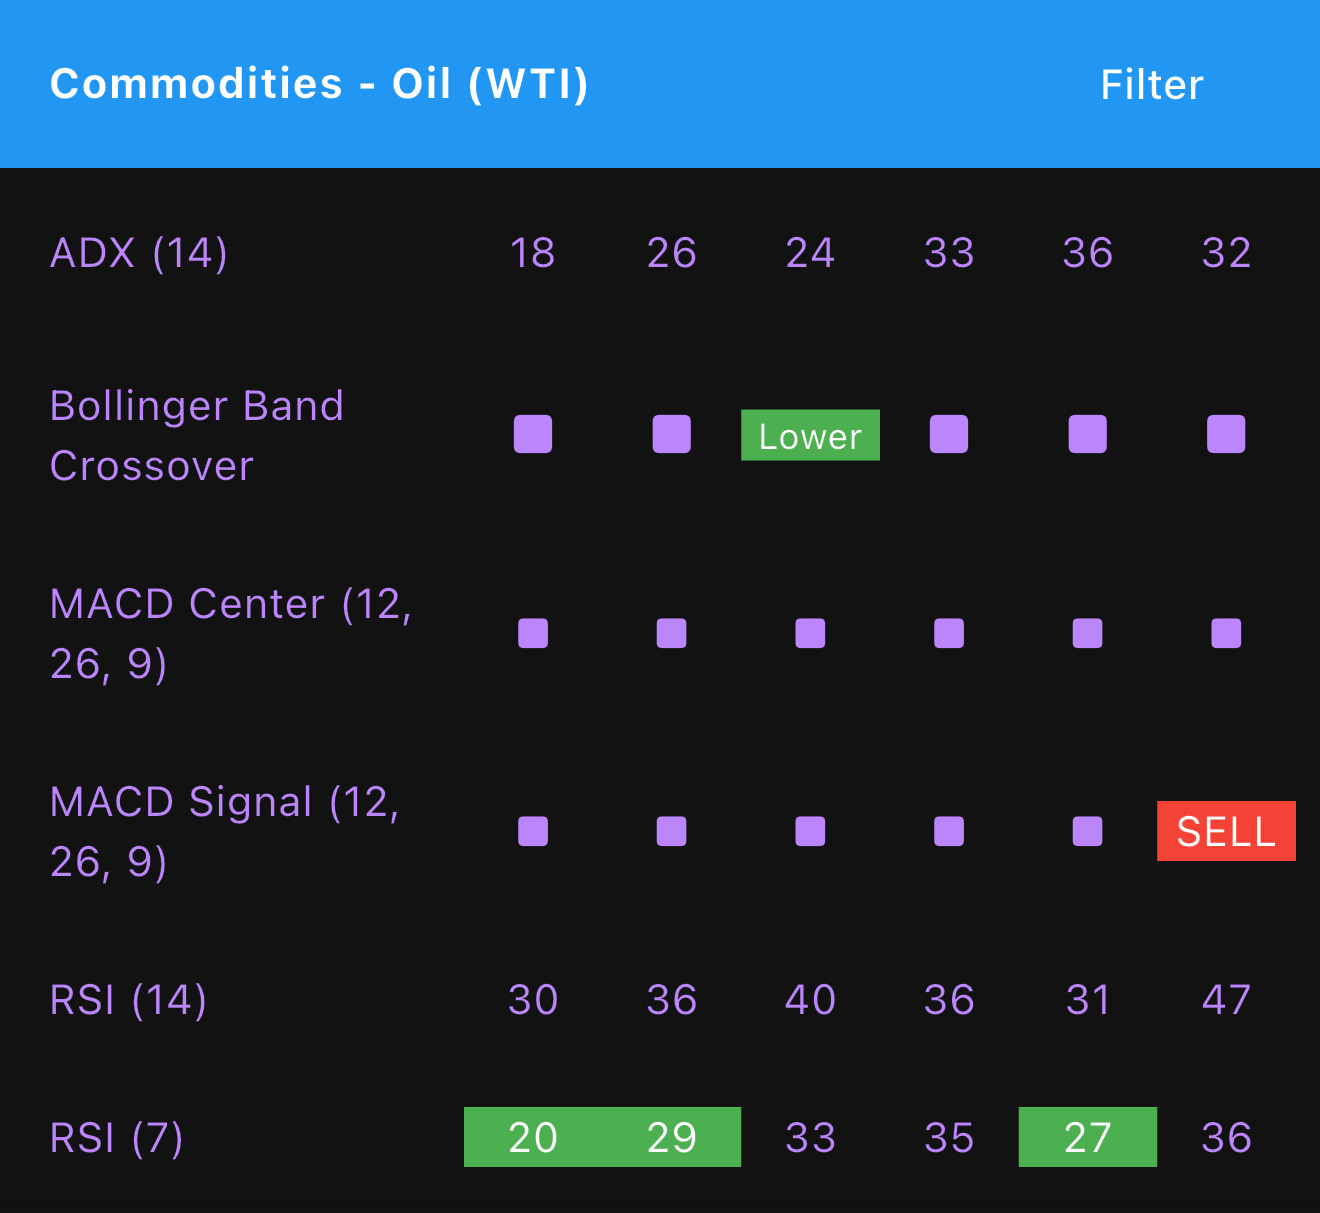
RSI (14)
Hovering between 30 to 36 across most timeframes
Not yet deeply oversold, but definitely cooling off
RSI (7)
Oversold on several timeframes:
M15: 20
M30: 29
H4: 27
This short-term exhaustion could lead to a brief bounce or consolidation
MACD Signal (12, 26, 9)
A Sell signal has been triggered on the H1 chart, reinforcing bearish momentum
Bollinger Band Crossover
Price breached the lower band on H1
This suggests a strong move outside the normal volatility range, which often precedes a pause or bounce
ADX (14)
Trend strength is picking up on H1 and H4 (33 and 36)
Indicates the current move still has momentum behind it
What This Means for Traders
The current setup points to strong downward pressure, but also signs of short-term exhaustion, especially on lower timeframes. If we see:
A MACD crossover reversal
RSI recovering above 30–40
Price closing back inside Bollinger Bands
… it could hint at stabilization or even a technical rebound.
But if the trend continues to strengthen on higher timeframes, further downside remains on the table.
We’ll continue watching the charts tonight during the U.S. session. If signals shift significantly, we’ll publish a follow-up.
Easy Dashboard (Android)
Easy Dashboard (iOS)
For support, contact us at support@easyindicators.com.